BREAKING GROUND
On the front lines of California’s race to brace for the Big One.
By Sarah Nightingale | Illustration by Gary Neill
You wake suddenly with a jolt. It’s pitch black, but you’re moving — and disoriented. It’s a dream, right? Boom. Crack. Your house is shaking. The windows are rattling. Car alarms whine in the street. You’re awake now and realize you’re experiencing a bad earthquake. When the shaking finally stops, you fumble around in the dark, first for your phone — no signal — and then for your shoes. You jump out of bed and flick the light switch. Nothing. Using your phone as a flashlight, you head downstairs, grab a jacket and your disaster kit, and step out into the street. Your neighbors tell you the quake was a 7.3 magnitude, and the epicenter wasn’t far away. Aftershocks reverberate throughout the day. The damage is substantial — roads, bridges, and buildings will take years to repair. But things could have been worse. Your government was ready. A dam on a nearby reservoir that might have failed was reinforced. A hillside subdivision that would have been buried by a landslide never got planning permission. Emergency services were funded and people in the neighborhood were prepared. That readiness stemmed from research by scientists at UC Riverside.
“That scenario was hypothetical, but as earthquake researchers, we try to anticipate and understand these kind of events,” said David Oglesby, a professor of geophysics. “By investigating the likelihood of a damaging earthquake in a particular region and assessing the related risks, we can help governments and communities prepare for the inevitable.”
When Oglesby joined UCR’s Department of Earth Sciences, now known as the Department of Earth and Planetary Sciences, in 2000, he was the university’s only full-time seismologist. That changed in 2005 with the arrival of James Dieterich, a renowned seismologist who developed some of the first mathematical models of earthquakes during his long tenure with the U.S. Geological Survey, or USGS.
“When Jim joined UCR, the earthquake research program really started to take off,” Oglesby said. “Over the years, we have developed a critical mass of researchers whose activities are different but very much complementary.”
UC Riverside is now home to 20 scientists — faculty members, researchers, and graduate students — who are using a variety of tools and techniques to untangle the complex physical processes that take place before, during, and after earthquakes. Their research ranges in scale from the colossal — studying the formation, structure, and movements of the Earth’s outer shell — to the minute — measuring how tiny shifts in the ground around faults may help or hinder more dramatic events. An overarching goal of UCR’s research and educational programs is to help governments, communities, and individuals prepare for future hazards. The university is also one of 18 core institutions guiding the Southern California Earthquake Center, a collaboration of more than 1,000 scientists conducting research and outreach on earthquakes. The group includes researchers from UCLA, USC, Caltech, and Stanford University, among others.
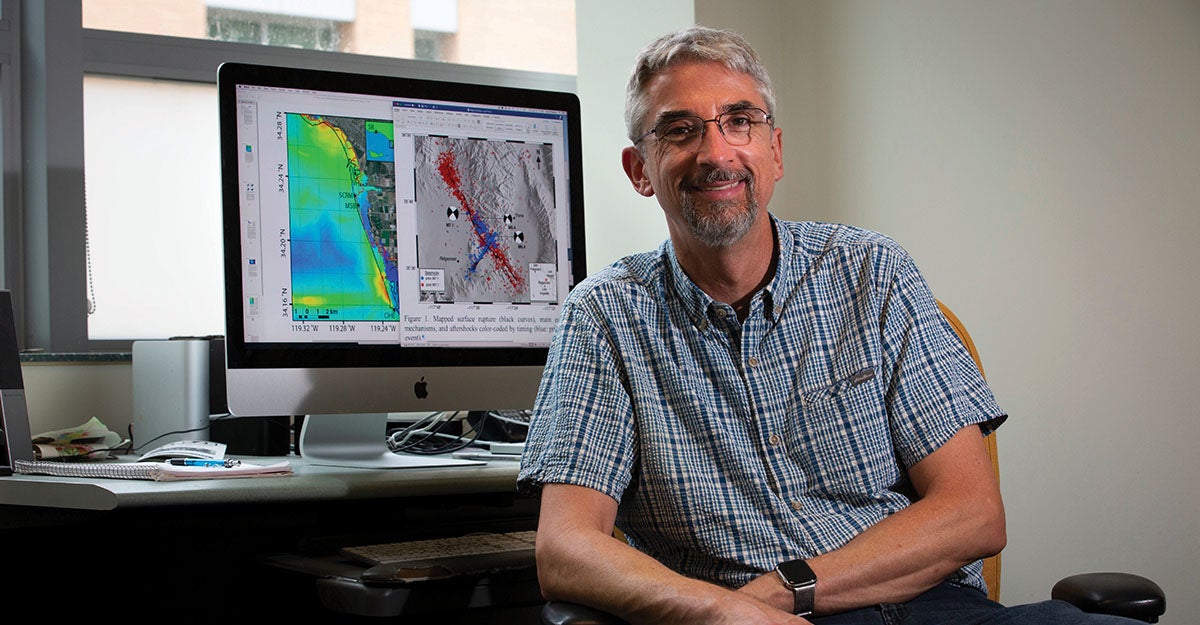
David Oglesby, a professor of geophysics, develops computerized numerical models of earthquakes, which can be used to characterize possible future earthquakes in a particular area. (UCR/Stan Lim)
Getting to the Core
While the holy grail in earthquake research is being able to predict a large event, UCR researchers are quick to say that is not possible now — and may never be.
“We tend to say that we’re not in the business of prediction, because that implies we can tell you the exact day, the exact place, and the exact magnitude,” said Gareth Funning, an associate professor of seismology. “What we can do is determine where a damaging earthquake is more likely, where it’s less likely, and give you the reasons why.”
So why are some regions more prone to damaging earthquakes than others? To answer that, you have to dig a little deeper into Earth’s structure. The planet has four layers: an inner core, outer core, mantle, and crust. The crust, together with the top portion of the mantle, forms a shell on the surface between 30 to 150 miles thick. This shell is fragmented into large pieces called tectonic plates that move slowly — about the speed your fingernails grow — sliding past or underneath one another, and bumping together like ice sheets on the surface of a frozen lake. The concept of plate tectonics has become a fundamental theory in the field of earth sciences, but it wasn’t formalized until the 1960s. Until then, another theory, continental drift, proposed the Earth’s large landmasses moved around on top of static ocean floors.
“It wasn’t until after World War II that scientists had the technology to visualize the ocean floor and observe a process called seafloor spreading, which is caused by the movement of tectonic plates,” said Heather Ford, an assistant professor of geophysics who uses the seismic waves produced by earthquakes as probes to explore the structure of the earth. “It really was an ‘aha’ moment, and pretty quickly after that scientists were able to understand a wide range of natural processes.”
Plate tectonics explains how continents that were once joined have separated over time. It accounts for the formation of mountains and ocean trenches, as well as Earth’s most dramatic naturally occurring events, including volcanoes and earthquakes.
“At the edges of tectonic plates are plate boundaries, which comprise systems of faults,” said Funning, who studies movements and deformations in Earth’s surface before, during, and after earthquakes. “Since the edges of the plates are rough, they get locked together while the rest of the plates keep moving. When the locked edges finally come unstuck, the energy that has been building up is released as seismic waves. These waves travel through the Earth to the surface, where we feel them as earthquakes.”
The USGS, the government agency responsible for monitoring earthquake activity, locates about 50 earthquakes of significant size worldwide each day, or 20,000 a year, using instruments called seismometers. Their strength is measured using a logarithmic magnitude scale, meaning a 1-point increase in the scale represents a 32-fold increase in the amount of energy released. Many more earthquakes — several million annually according to USGS estimates — go undetected because they are either too weak or in remote locations away from seismometers.
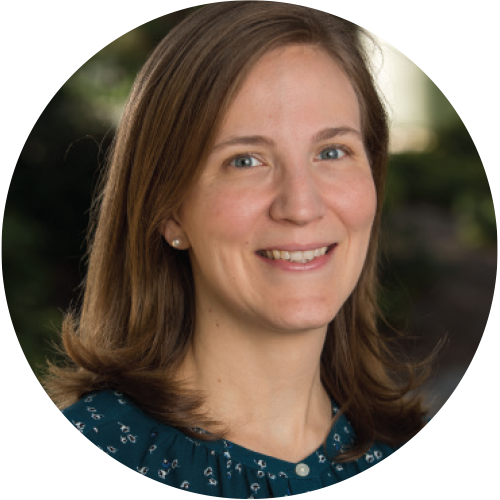
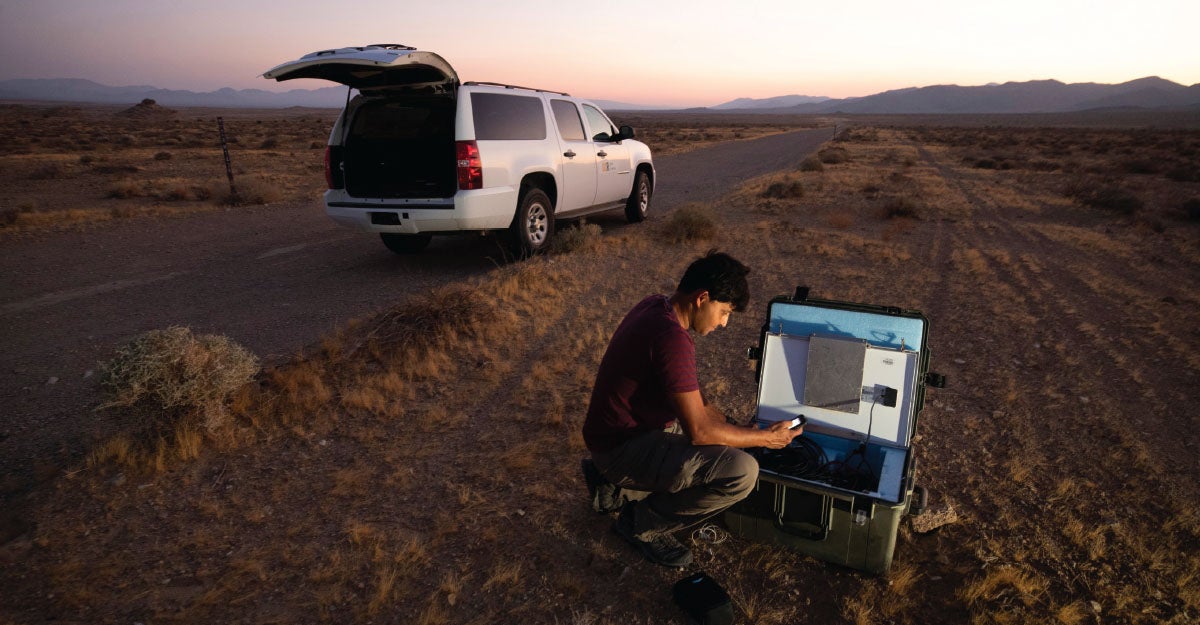
Abhijit Ghosh, associate professor of geophysics, measures ground movements in the desert near Ridgecrest, which saw two back-to-back earthquakes in July 2019. (UCR/Stan Lim)
A Maze of Faults
More than 90% of the world’s earthquakes, including some of the most violent and dramatic on the planet, occur in the so-called Ring of Fire, a 25,000-mile horseshoe-shaped arc that frames the Pacific Ocean. The San Andreas Fault, which makes up part of the Ring of Fire, extends about 750 miles through California and is the tectonic boundary between the Pacific Plate — home to the cities of Santa Cruz, Los Angeles, Riverside, and San Diego — and the North American Plate — home to most of the San Francisco Bay Area, the Central Valley, and Joshua Tree National Park. The Pacific Plate’s northwesterly journey relative to the North American Plate has caused many powerful earthquakes as the plates slide against one another, including the damaging 1857 Fort Tejon earthquake in Southern California and the 1906 San Francisco quake that destroyed 28,000 buildings and resulted in 3,000 deaths. When people think about the San Andreas Fault, they often imagine a single, large fracture. That’s not the case, Ford said.
“The San Andreas Fault is the primary fault in the San Andreas Fault System, but there are hundreds of other active faults in California that together accommodate the movement between the Pacific Plate and the North American Plate,” Ford said.
Other notable faults in California include the Hayward Fault in Northern California, the Garlock Fault that runs East-West along the northern edge of the Mojave Desert, and the San Jacinto Fault in Inland Southern California, which is less than 5 miles from the UCR campus. The university’s researchers are not only studying the seismic activity in these zones, they are also identifying new faults, including work by Roby Douilly, an assistant professor of seismology, to uncover buried faults, which may be miles beneath the Earth’s surface but still wreak havoc above.
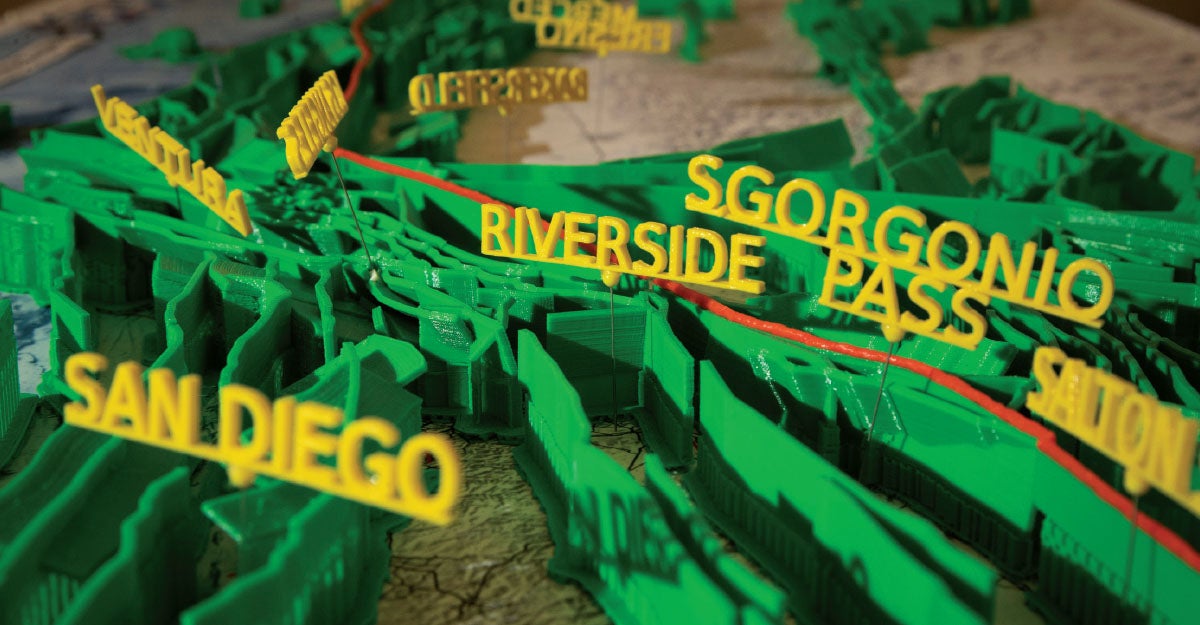
A 3D printed model of the California fault system. (UCR/Stan Lim)
“Whether you are 10 miles or 50 miles from the San Andreas Fault, if an earthquake happens in California, you will be affected,” said Abhijit Ghosh, an associate professor of earthquake seismology, whose studies in California, Nepal, and New Zealand help explain how small changes in stresses along faults affect their stability. “California is a maze of faults, and no matter where you live, you are not too far from a fault that can produce a damaging earthquake.”
Two earthquakes over the 2019 July Fourth holiday in rural Kern County gave UCR researchers a lens to focus on California’s complex fault system. The powerful tremors took place within 36 hours of each other on neighboring, unnamed faults near the small town of Ridgecrest, 120 miles northeast of Los Angeles. Measuring 6.4 and 7.1 on the earthquake magnitude scale, the quakes were felt by millions of people across California, Arizona, Nevada, and Baja California, Mexico.
“Had a magnitude 7.1 quake happened anywhere near an urban area such as Los Angeles, it would have been disastrous,” Ghosh said.
On July 6, Ghosh and his graduate researchers drove to Ridgecrest and installed a series of seismometers in a large circle surrounding the faults that ruptured. The instruments, still in place today, are measuring how the ground moves in response to thousands of aftershocks, which are small tremors that take place after a main earthquake has occurred. These recordings allow Ghosh to map the 3D structure of the faults and pinpoint the tensions that caused the earthquakes.
“We know the events occurred on different faults, so our first question was, did the 6.4 magnitude earthquake on July 4 set off the 7.1 earthquake on July 5?” Ghosh said. “We also know the Ridgecrest earthquakes changed the stress of the surrounding faults, which could increase the likelihood of a large earthquake occurring on the Garlock Fault that runs about 30 miles east of Bakersfield.”
Both Ghosh and Funning are also studying a process called slow slip or fault creep. Creep events, which are so subtle scientists didn’t know they existed until the mid-1990s, are slow movements in fault zones that can play a big part in earthquake formation. To identify creep, Funning uses
a highly sensitive version of the GPS tool in our smartphones to track tiny, continuous movements in the Earth’s crust. His research has helped identify creep on parts of the Hayward Fault near the San Francisco Bay and on the Rodgers Creek Fault, which runs up the west side of the Sonoma Valley toward Santa Rosa.
“Finding evidence of creep in a fault can be a good thing because these slow movements can release strain without a big earthquake,” Funning said. “And knowing which segments creep and which are locked helps us understand where along a particular fault large earthquakes are more likely.”
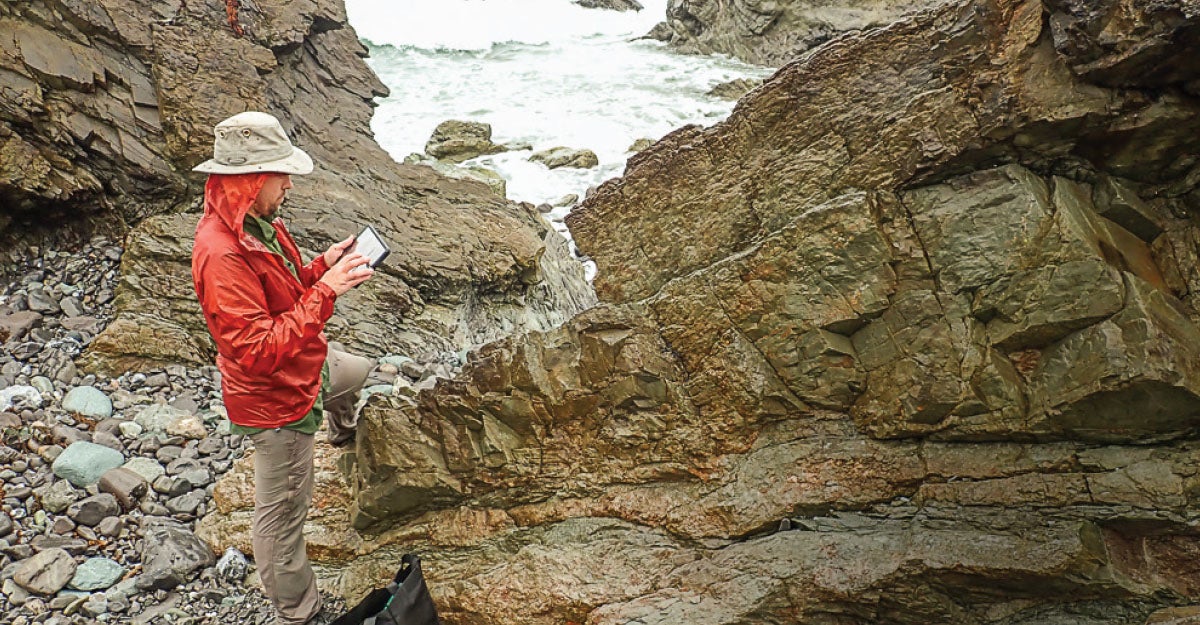
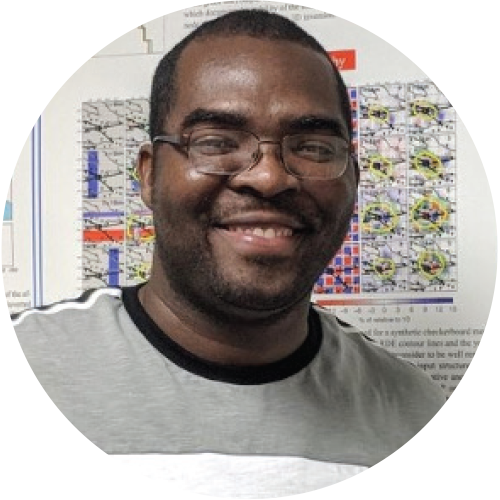
Nicolas Barth, assistant professor of geology, analyzes rocks in New Zealand to determine the rate at which they have been brought to the surface by long-term fault activity. (Photo by Andre Mere)
Learning from the Past
While Ghosh and Funning hone in on California’s complex fault system, Nicolas Barth, an assistant professor of geology, focuses on the Alpine Fault, which runs the length of New Zealand’s South Island.
“The Alpine Fault is a relatively simple fault, so it’s a natural lab experiment we can use to understand more complex systems like the San Andreas Fault,“ Barth said.
Using a tool called LiDAR, which stands for Light Detection and Ranging, Barth visualizes changes in the landscape caused by past earthquakes. This laser-based system, usually deployed from an airplane, bathes the landscape in light — up to 200,000 pulses per second — producing a precise view of the Earth’s surface hidden beneath vegetation. By coupling LiDAR data with sediment samples he analyzes in the lab, Barth can tell when a past earthquake occurred, its severity, and what happened in the aftermath.
“We are finding that large earthquakes have more dramatic landscape effects than we previously thought. They can trigger thousands of landslides, cause rivers to change course, and create large volumes of sediment that can choke flood control basins and reservoirs,” Barth said. “It is important to not just think about the instant effects of earthquakes, but also the ones that will persist for decades after.”
Barth works with Keith Richards-Dinger, an associate researcher at UCR, to create computer simulations of Alpine Fault earthquakes over many tens of thousands of years, which can then be compared against the 4,000-year record of past earthquakes. They are able to identify why some locations on a fault can allow an earthquake to come crashing to a halt and at other times allow earthquakes to rupture through.
“We call these locations ‘earthquake gates,’ and they are an important line of research in Southern California currently,” Barth said, citing the San Gorgonio and Cajon passes as examples.
Finding out whether earthquakes rupture through San Gorgonio Pass is of utmost importance to researchers.
“A San Andreas quake starting near the Salton Sea would direct considerably more energy toward Los Angeles if it is able to rupture through the pass and keep going,” Barth said.
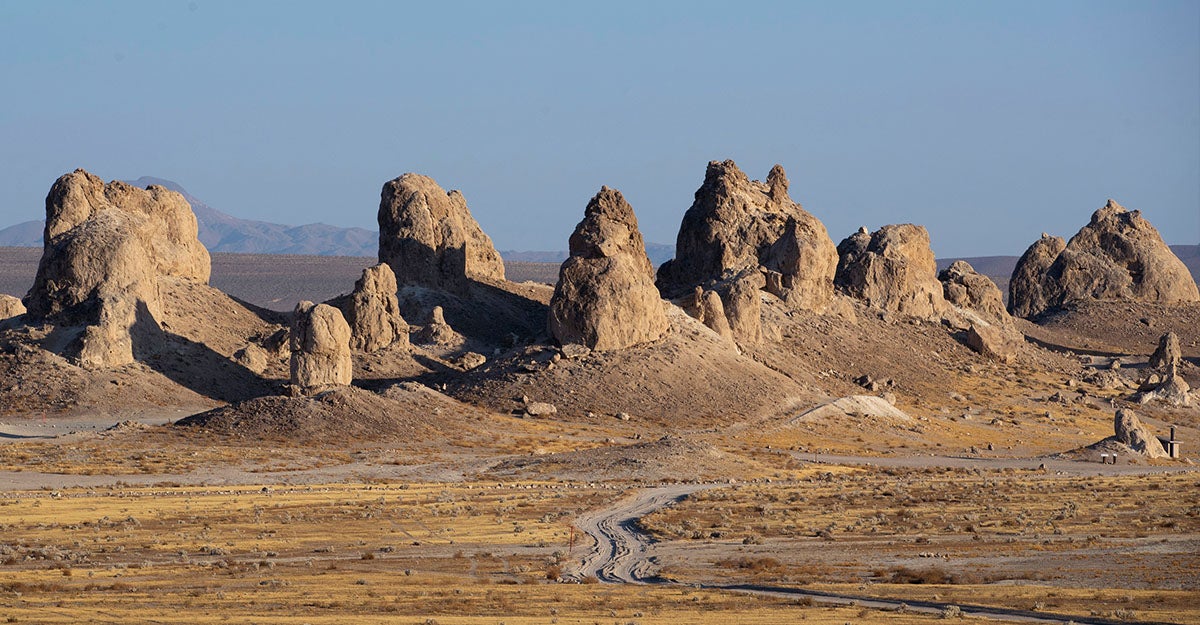
The Trona Pinnacles in the desert outside of Ridgecrest. (UCR/Stan Lim)
Model Behavior
While shedding light on the history and structure of our planet is one of the main reasons to study earthquakes, Oglesby said, another is reducing damage and helping save lives.
“I think as researchers at a university in an earthquake-prone region, that’s particularly important to us,” he said.
Oglesby and Douilly both specialize in developing computerized numerical models of earthquakes, which can be used to characterize possible future earthquakes in a particular area. For them, each measurement of earthquake activity, each data point from a past event, and each newly discovered fault is an ingredient in a recipe that promises better tools for assessing risk and saving lives.
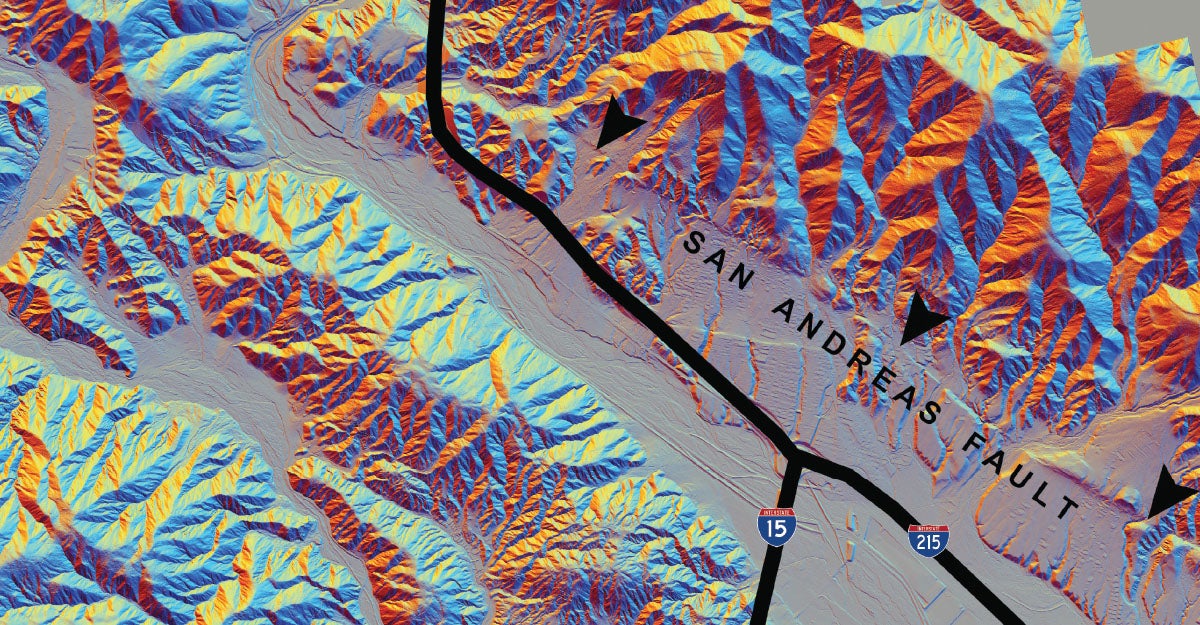
The Cajon Pass, about 20 miles north of UC Riverside’s campus, is a critically important corridor where many lifelines, such as power lines and railroads, supporting the greater L.A. region cross the San Andreas Fault system. Better understanding fault rupture in this region is an active interest of geoscientists and disaster planners. (Graphic by Nicolas Barth)
“If we know the faults that are operating in that area and what stresses are on those faults, we can start to make predictions about what might happen,” Oglesby said.
Numerical earthquake models can help researchers and officials gauge whether large or small earthquakes are more likely along a particular fault, how much damage a city might experience based on the size of a fault rupture, and whether to expect a landslide every time there’s an earthquake in a particular region, among other things. Oglesby said earthquake models, along with recordings of ground motion from past earthquakes, are used by cities and planners to develop building codes, by engineers to design earthquake-resistant buildings, and by governments to allocate resources for disaster management and help ready their citizens. Ghosh, who coordinates UCR’s participation in the annual Great California ShakeOut earthquake preparedness event, said anyone living near major faults should know what to do during an earthquake and have emergency supplies on hand.
“California is overdue for another large earthquake, so it’s not a matter of whether we’ll have to deal with that, but when,” Ghosh said. “And being prepared and knowing how to react can determine whether you live or die.”
